Why Good PageSpeed Scores Don’t Mean a Fast WordPress Site
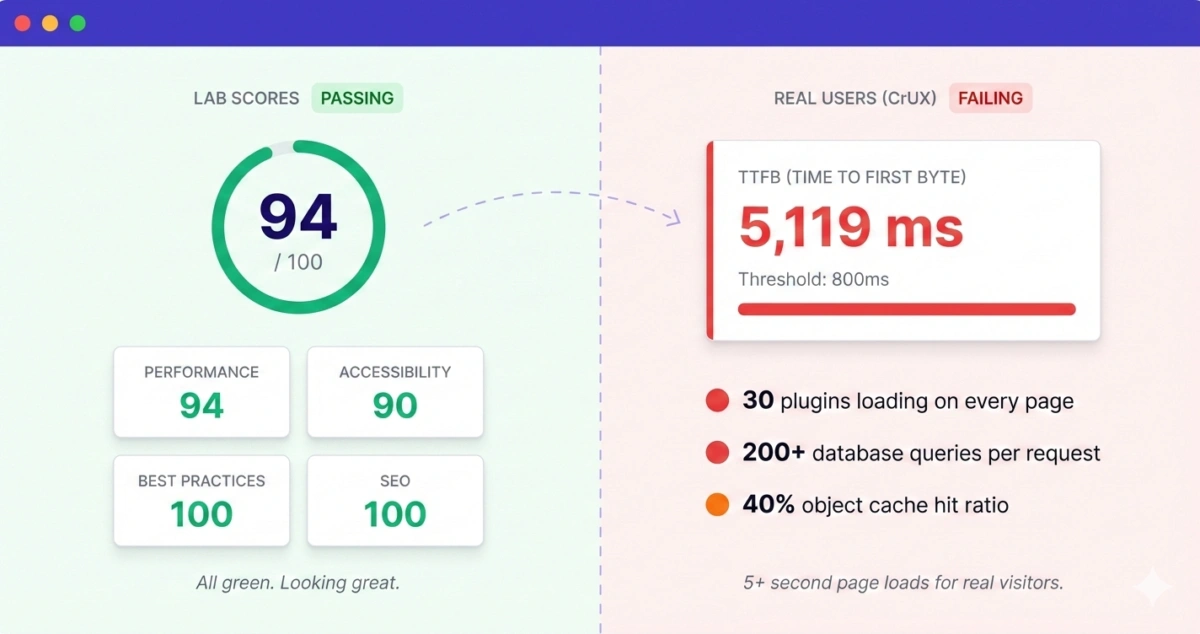
We ran PageSpeed Insights on a client’s WooCommerce store a few weeks ago. 90 Performance, 90 Accessibility, 100 Best Practices, 100 SEO.
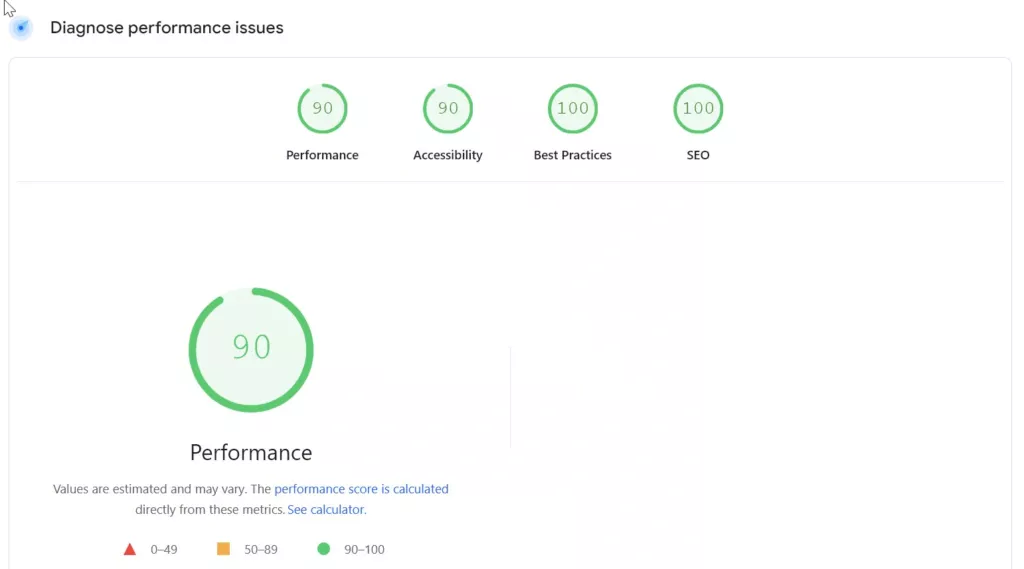
All green. By every metric PageSpeed reports, this was a well-optimized site. But the store owner told us pages took forever to load, customers were abandoning carts, and their Google rankings had been sliding for months. We could feel it too, clicking around the admin took 4-5 seconds per page.
Turns out, PageSpeed was telling the truth about the things it measures. It just doesn’t measure most of what makes a WordPress site actually fast or slow.
What PageSpeed Insights Actually Tests
PageSpeed Insights runs a Lighthouse audit in a simulated environment. It loads your page once, on a simulated mid-tier phone with a throttled 4G connection, and measures frontend rendering metrics. How quickly does content appear? Does the layout shift around? Can the user interact with it?
These are useful things to know. But here’s what people miss: Lighthouse tests a single, cold page load from an external perspective. It doesn’t know or care what’s happening on your server. It can’t see your PHP execution time, your database queries, your plugin overhead, or your server’s response under real traffic.
Think of it this way. You take your car to an inspector who checks the paint, the tires, and the headlights. Everything passes. But nobody opened the hood.
Lab Data vs. What Real Users Experience
PageSpeed Insights actually has two sections, and most people only look at one. The top section shows “field data” from the Chrome User Experience Report (CrUX). This is real data from real Chrome users visiting your site over the previous 28 days. The bottom section is the Lighthouse lab test.
The lab score is what most people screenshot and celebrate. But the field data told a completely different story for this client.
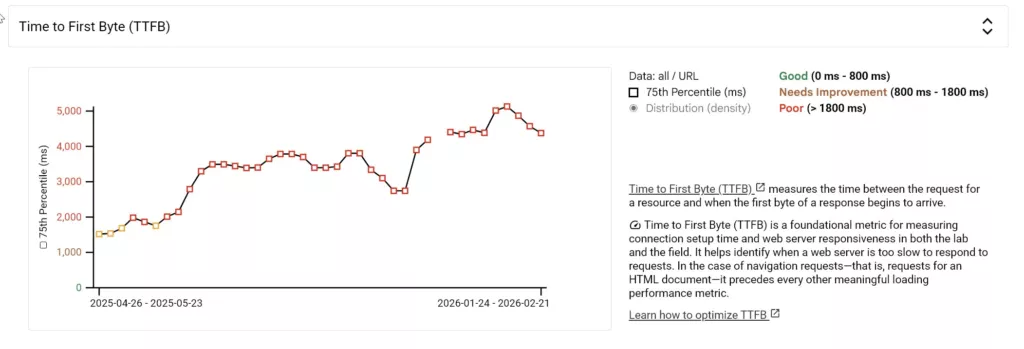
Their Time to First Byte (TTFB) in CrUX was 5,119ms. Over five seconds before the server even starts sending the page. No amount of image optimization or CSS minification fixes that, because those are frontend optimizations. The bottleneck was server-side, and PageSpeed’s lab test mostly ignores server-side performance because it only captures a single page load on an already-warmed server.
For anyone unfamiliar with TTFB, it’s the time between a user clicking a link and the server starting to respond. Google considers anything over 800ms to be poor. This site was over 6x that threshold.
Where the Real Problems Were
We started digging into the server side. Not the code that runs in the browser, but the PHP, the database queries, and the plugin stack that runs on every single page request before the browser even receives a byte of HTML.
Here’s what we found.
Plugins Running Where They Shouldn’t
This store had around 30 plugins. Not unusual for WooCommerce. But many of them loaded their code on every single page, including pages where they did absolutely nothing. A reviews plugin initializing its JavaScript and running database queries on the checkout page. A product comparison tool loading on blog posts. An analytics plugin making external API calls on every admin page.
Each one adds a small overhead. Maybe 50-100ms individually. But they stack. Thirty plugins each adding a little bit of overhead to every request adds up to seconds of server processing time before WordPress even starts building the page.
PageSpeed doesn’t see this. It sees the final rendered page and evaluates how the browser paints it. The 2-3 seconds the server spent loading unnecessary plugin code? That’s invisible in a lab test that runs on an already-cached page.
External API Calls Blocking Page Generation
Three different plugins were making external HTTP requests during page generation. Not async background tasks. Synchronous calls that blocked the page from rendering until the remote server responded.
One was checking license validity on every page load. Another was fetching exchange rates from an external API for a currency switcher. The third was pulling social share counts.
When those external servers responded quickly, the page loaded in 2 seconds. When one of them was slow or timed out, the page took 8-10 seconds. This kind of intermittent slowness is one of the hardest things to diagnose because it doesn’t happen on every request. PageSpeed runs one test, gets a fast response from the external servers, and says everything’s fine.
Database Queries Multiplying
The WooCommerce product pages were running over 200 database queries each. For a single product page. Some of these were N+1 queries, a pattern where code loads a list of items and then runs a separate query for each item’s details instead of fetching everything at once.
For a product with 12 variations, the variation data alone generated 40+ queries. Multiply that across related products, upsells, cross-sells, and recently viewed items, and a single page visit was hammering the database.
On a staging site with one user, this loads in under a second. Under real traffic with 50 concurrent visitors, the database becomes the bottleneck and response times spike. PageSpeed tests from a single connection, so it never sees contention.
Object Cache Misses
The site had Redis installed for object caching, which should reduce database load significantly. But several plugins were bypassing the cache entirely, either by using wp_cache_delete aggressively or by running direct database queries that skip WordPress’s caching layer.
The cache hit ratio was around 40%. It should be 80-95% for a well-configured WooCommerce site. So all the queries we mentioned above? Most of them were hitting the database directly instead of being served from memory.
The Cumulative Effect
None of these issues individually would have shown up as a clear red flag. A plugin adding 80ms of overhead isn’t alarming. A few extra database queries seem harmless. One external API call is standard.
But combined, across 30 plugins, with 200+ database queries per page, three blocking API calls, and a cache that’s only partially working, the server response time ballooned to 3-5 seconds on average. Under traffic spikes during promotions, it hit 8-10 seconds.
Meanwhile, PageSpeed kept reporting green scores because the frontend was well-optimized. Images were compressed, CSS was minified, JavaScript was deferred. All the things you’re told to do. None of them relevant to the actual problem.
How to Actually Measure WordPress Performance
If you suspect your WordPress site is slow despite good PageSpeed scores, here’s where to look.
Check your CrUX data first. In PageSpeed Insights, scroll past the lab score to the field data section at the top. If your TTFB is in red or orange, you have a server-side problem that no frontend optimization will fix. You can also check CrUX data directly through CrUX Vis, which gives you a cleaner view of real-user metrics over time.
Use Query Monitor. Install the Query Monitor plugin temporarily on your site. It shows you exactly how many database queries each page runs, which plugins are the heaviest, and how long PHP execution takes. You’ll often find a handful of plugins responsible for the majority of overhead.
Test under realistic conditions. Tools like WebPageTest let you test from real browsers in real locations. Run a test with “First View” (no cache) and look at the TTFB. If it’s consistently over 1 second, the problem is server-side.
Monitor over time, not once. A single test captures one moment. Performance problems are often intermittent, caused by traffic spikes, external API timeouts, or cron jobs running at bad times. You need continuous monitoring to see the full picture.
This is actually something we’ve been dealing with repeatedly across client projects, and it’s the reason we’re building SiteVitals. It’s a monitoring tool specifically designed to track server-side WordPress performance over time, the kind of problems that PageSpeed doesn’t catch. We’ll have more to share on that soon.
What We Did for This Client
No custom code. No host migration. Everything was configuration.
We went through the plugin stack and adjusted settings. A video embed plugin was making server-side API calls far more aggressively than it needed to. Dialed that back. Another plugin was just dead weight, generating overhead on every request without doing anything the store actually used. Removed it. The rest we kept, but tightened their configs. How often they phone home, how they load assets, how they handle their own caching. Most plugins ship with defaults tuned for compatibility, not performance. Across 30 of them, that gap adds up fast.
Server side, we bumped the PHP memory limit in wp-config, increased OPcache so compiled PHP wasn’t getting thrown away between requests, and raised the LiteSpeed object cache TTL. That last one was set absurdly low. Objects were expiring and rebuilding constantly, which basically meant the cache existed but wasn’t caching anything. Small config changes, but they let the server actually use the infrastructure it already had.
Then a database cleanup. Revisions, expired transients, orphaned metadata. Years of accumulation that nobody notices until you look at query times.
That was it. TTFB dropped dramatically. The site went from sluggish to responsive, and Core Web Vitals in Search Console flipped from failing to passing once CrUX collected enough fresh data. The PageSpeed lab score barely moved. Because the problems were never in the things PageSpeed measures.
The Takeaway
PageSpeed Insights is useful for what it tests. It just doesn’t test most of what makes a WordPress site feel slow.
If your scores are green but pages drag, stop compressing images and start looking at what your server does on every request. Check TTFB in your CrUX data. Install Query Monitor. Pay attention to how your plugins actually behave under real traffic. That’s where the problems are.
About the Author